.
global patterns of food supply
inequalities in world food distribution
We globally produce enough food to give the whole world's population an adequate and balanced diet. We need, therefore, to question why so many people often go without food. It is also important that we understand the reasons for these inequalities in world food distribution.
the spatial distribution of agriculture
The spatial distribution of the world's agricultural workforce is highly uneven. Some 95% of farmers and farm workers live in less developed countries, the vast majority in Asia. However, less developed countries account for only 59% of all agricultural land. This suggests that a great deal of farming activity in these countries is a) labour intensive and b) based on very small farms. There is a similar mismatch at the global scale between agricultural land area and the value of output. Thus Europe, with just 3.5% of the world's agricultural area, accounts for nearly 20% of the value of world agricultural production. In contrast, Africa has 17.5% of the world's agricultural area, but contributes only 5.5% to the value of agricultural production. These regional differences between area and output are due to:
> the variable quality of physical resources for agriculture
> variations in levels of farming technology and farm management, including automation and the use of fertilisers
> the relative importance of commercial agriculture (where crops are sold for cash) and subsistence agriculture (where most crops are for consumption on the farm)
> the greater demand for high-value crops (e.g. meat and horticultural products) in developed countries
global food supply and consumption
> Much food is STILL produced and consumed locally (especially in poorer countries), or in the cases of richer countries nationally produced and consumed, as has been the case for a long time.
> An increasing proportion of food is produced not for domestic markets but for sale on the global market place. This is driven by specialisation and the commercialisation of agriculture. Within these fields the goal is to maximise output by simplifying the process and using economies of scale.
> The actions of Transnational Corporations and the need for poorer governments to raise income through export earnings has led to the commercialisation and export of many crops from poorer nations, even if there are local food shortages.
> Food is travelling increasingly long distances, as airplane, boat and freight technology advances, together with improvements in storage techniques to maintain food stays fresh and refrigeration.
> Demand for non-seasonal food stuffs in richer nations is at record highs (e.g. strawberries in the UK in winter flown in from Chile), but this is changing as people become aware of the impact of FOOD MILES.
> Many countries are net importers of food i.e. they do not produce enough food domestically so have to import more than they export to cover the gap. Many countries in this situation are in Sub-Saharan Africa where undernourishment is rife, but this is also the case in the UK. Few countries are net exporters of food (exports are greater than imports) and these countries rarely have undernourished people (e.g. USA, Canada, Australia, New Zealand, Argentina).
> As Figure 1 below shows, the number of calories consumer per day in the period 1999-2001 was high throughout the developed world, with many countries having an average consumption of over 3,000 calories per person per day. In sub-Saharan Africa and parts of south east Asia, consumption was below 2,200 calories per person per day. The situation was improving, as many of the countries with a low calorie intake showed a growth in food consumption over a similar period (Figure 2). There are, however, a number of areas where calorie consumption actually fell during this period, the Sudan being one example.
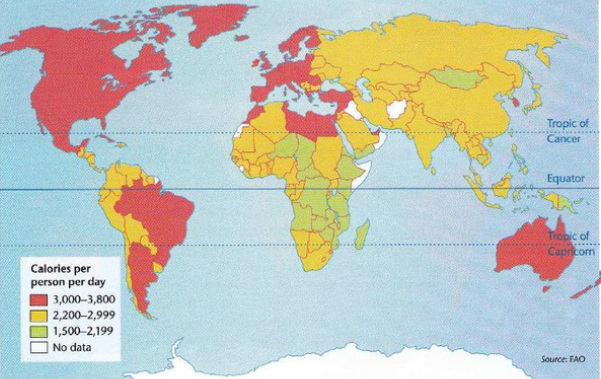
Figure 1: Food consumption, 1999-2001
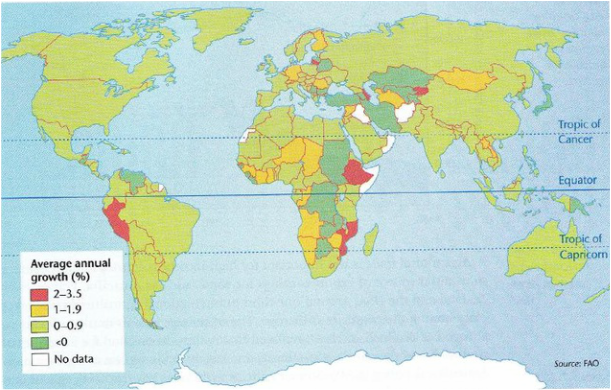
Figure 2: Growth in food consumption, 1995-2001
> However, it is important to remember that hunger is not confined to the less developed parts of the world. The Donate-A-Meal website is for a charity which works in Dusseldorf, Germany: an important member state of the EU, a major industrial power. Interact with the site for a few moments. It has been very cleverly designed so that you 'interact' with the children, and are 'thanked' for your donation with a smile.
CONSUMPTION - DID YOU KNOW?
> There is enough food to feed everybody in the world for 1 year.
> 13.1% of the world's population is hungry
> In 2010, an estimated 7.6 million children - more than 20,000 a day - died from hunger.
> Nearly 98% of worldwide hunger exists in underdeveloped countries.
> While hunger exists worldwide, 62.4% of the hunger exists in Asia/South Pacific.
global trade
Agricultural trade is less important for high income countries but it remains a substantial source of export earnings for some, such as Australia, France, New Zealand and the USA. Around one third of international agricultural trade takes place among the countries of Europe. The once-large import market of western Europe has declined and been replaced by a net export position for a number of commodities (e.g. cereal, sugar, meat) due largely to the success of the Common Agricultural Policy (CAP). Some Pacific rim countries have growing agricultural imports due to high income growth based on manufacturing and almost the whole of Africa is in a position where imports exceed exports.
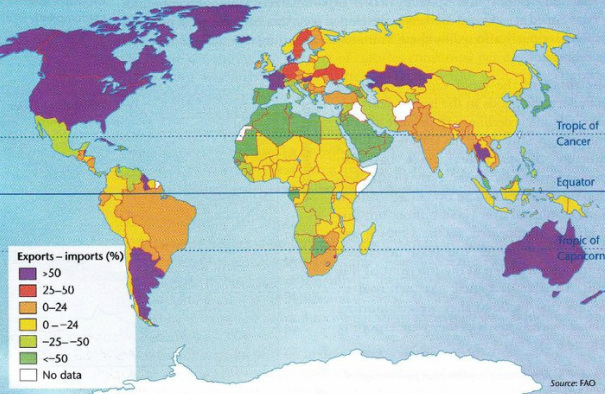
Figure 3: Net trade in food, 2000-2002
Despite the declining importance of agricultural exports for developing countries as a whole, some of them still rely heavily on agricultural exports for their foreign earnings. Heavy reliance on a few crops often shows that these economies are small.
FAIRTRADE
One aspect of international trade in food in recent years has been the emergence of fair trade. Under fair trade agreements agricultural products such as bananas, coffee, nuts, orange juice, tea and wine are sold to companies in the developed world as a rate above market price. This extra money is used to provide a better standard of living for the producers. The global market for fair trade produce was worth over £350 million in 2005, with sales in countries that license the Fairtrade brand growing at about 20% per year. In 2005, Fairtrade coffee accounted for 5% of all coffee consumed in the UK.

THE GEOGRAPHICAL FLOW OF WORLD TRADE IN FOOD
The flows of trade in agricultural products are enormously complicated but some trends do stand out.
> The most important trend is the flow of food from rural areas to urban areas. This flow can be seen in every country and region with any trade in agricultural products.
> Then there are the flows from the major grain-producing mid-latitude areas to the world's industrial areas. The former include the prairies of North America and the industrial areas include the industrial north east and west coasts of the USA.
> For many years there has been a flow of tropical produce (particularly plantation produce such as sugar, bananas, pineapples and coffee) from tropical regions to the temperate regions. Indeed this trade was one of the motivating forces behind the creation of the European empires of the 19th and 20th centuries. In recent years, with the development of cheap air transport, this flow has been joined by the flow of luxury products such as early vegetables and flowers to the supermarket chains of the industrialised countries.
> A similar flow is the movement of meat and meat products from tropical regions to the industrialised countries. The most notorious example of this is the flow of meat from the cleared areas of the former Amazon rainforest to help provide the burgers and other meat products for North American and other world markets.
> Less well known in the West, but absolutely vital, is the movement of rice from countries in south east Asia - Thailand, Malaysia, Burma, etc. - to the major population centres further north, particularly India and China. India and China are the two biggest producers of rice in the world, but they still rely on imports to ensure their populations are fed.
> The final flow generally takes the form of aid rather than trade. This is the movement of grain and other foodstuffs from North America and Europe to areas of acute malnutrition, mostly in Africa but also in some parts of South America and south Asia.
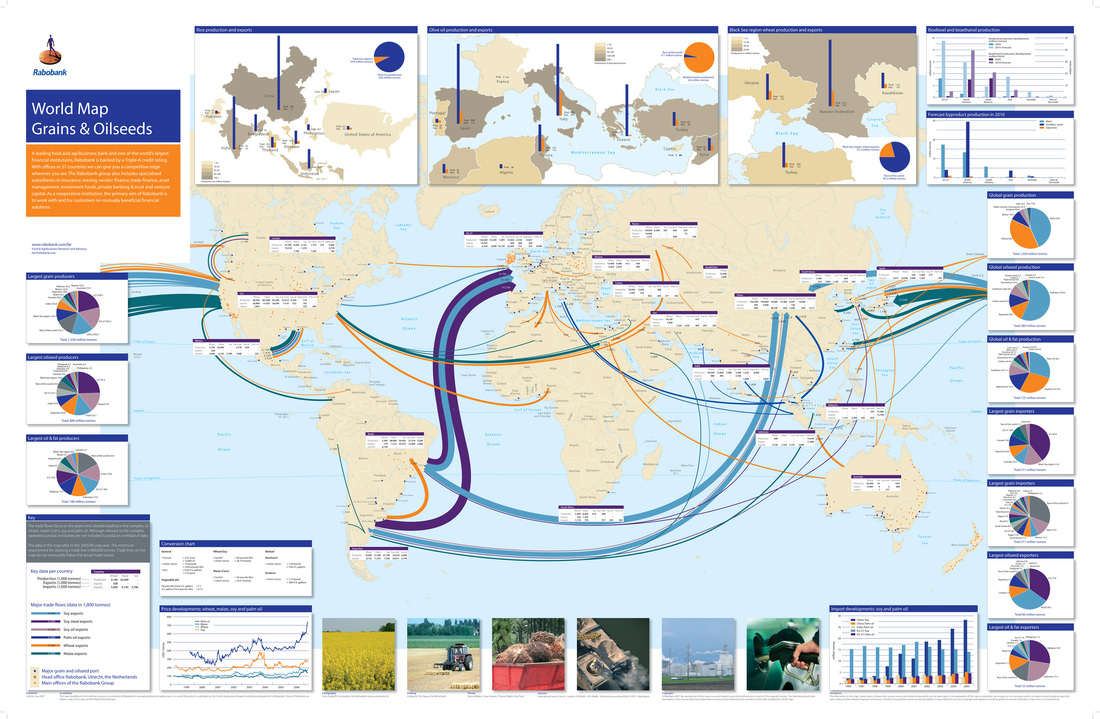
The map below shows just how complicated global trade is - and this map only shows grains and oilseeds!
The flows of trade in agricultural products are enormously complicated but some trends do stand out.
> The most important trend is the flow of food from rural areas to urban areas. This flow can be seen in every country and region with any trade in agricultural products.
> Then there are the flows from the major grain-producing mid-latitude areas to the world's industrial areas. The former include the prairies of North America and the industrial areas include the industrial north east and west coasts of the USA.
> For many years there has been a flow of tropical produce (particularly plantation produce such as sugar, bananas, pineapples and coffee) from tropical regions to the temperate regions. Indeed this trade was one of the motivating forces behind the creation of the European empires of the 19th and 20th centuries. In recent years, with the development of cheap air transport, this flow has been joined by the flow of luxury products such as early vegetables and flowers to the supermarket chains of the industrialised countries.
> A similar flow is the movement of meat and meat products from tropical regions to the industrialised countries. The most notorious example of this is the flow of meat from the cleared areas of the former Amazon rainforest to help provide the burgers and other meat products for North American and other world markets.
> Less well known in the West, but absolutely vital, is the movement of rice from countries in south east Asia - Thailand, Malaysia, Burma, etc. - to the major population centres further north, particularly India and China. India and China are the two biggest producers of rice in the world, but they still rely on imports to ensure their populations are fed.
> The final flow generally takes the form of aid rather than trade. This is the movement of grain and other foodstuffs from North America and Europe to areas of acute malnutrition, mostly in Africa but also in some parts of South America and south Asia.
The map below shows just how complicated global trade is - and this map only shows grains and oilseeds!
feeding the world population
The world's population is forecast to grow to 9 billion by 2040. According to the pessimists, the world is moving from an era dominated by food surpluses to one dominated by food scarcity and rising grain prices.
This growth, and increasing affluence, is straining the capacity of the world to feed the entire population. Most regions should be able to raise food production in line with population growth. However, sub-Saharan Africa is likely to be the exception, due to a combination of poverty, civil war, and rapid population growth. The latest challenge faced in this area is the Ebola outbreak which has caused disruptions in food trade and marketing. In the three West African countries most affected by Ebola, food has become increasingly expensive and hard to come by, while labour shortages are putting the upcoming harvest season at serious risk.
This growth, and increasing affluence, is straining the capacity of the world to feed the entire population. Most regions should be able to raise food production in line with population growth. However, sub-Saharan Africa is likely to be the exception, due to a combination of poverty, civil war, and rapid population growth. The latest challenge faced in this area is the Ebola outbreak which has caused disruptions in food trade and marketing. In the three West African countries most affected by Ebola, food has become increasingly expensive and hard to come by, while labour shortages are putting the upcoming harvest season at serious risk.
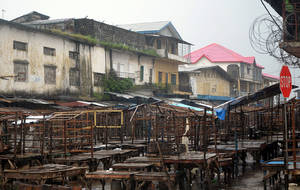
An empty street market in Monrovia's West Point district, 20 August 2014
Feeding growing populations will involve a huge increase in global trade. It will also put increased pressure in water resources and soils.
BRITISH RED CROSS - FOOD SECURITY
BRITISH RED CROSS - FOOD SECURITY
